LiDAR Peak Analysis: What It Takes

Items that do not fit the categories above.
Forum rules
  • This is a mountaineering forum, so please keep your posts on-topic. Posts do not all have to be related to the 14ers but should at least be mountaineering-related.
  • Personal attacks and confrontational behavior will result in removal from the forum at the discretion of the administrators.
  • Do not use this forum to advertise, sell photos or other products or promote a commercial website.
  • Posts will be removed at the discretion of the site administrator or moderator(s), including: Troll posts, posts pushing political views or religious beliefs, and posts with the purpose of instigating conflict within the forum.
For more details, please see the Terms of Use you agreed to when joining the forum.
User avatar
JoeGrim
Posts: 25
Joined: 5/2/2017
14ers: 3 
13ers: 8
Trip Reports (0)
 
Contact:

Re: LiDAR Peak Analysis: What It Takes

Post by JoeGrim »

Now that we have assessed the prominences of thousands of peaks, I wanted to do an analysis of how much the LiDAR prominence differs from the topo map prominence. So, I created a histogram of LiDAR prominence - map prominence below of the P240s that a group of us have been analyzing (P240s are peaks that have at least 6 DEM 40 ft contours around them, but weren't considered to be soft ranked - 665 analyzed so far.)
Image
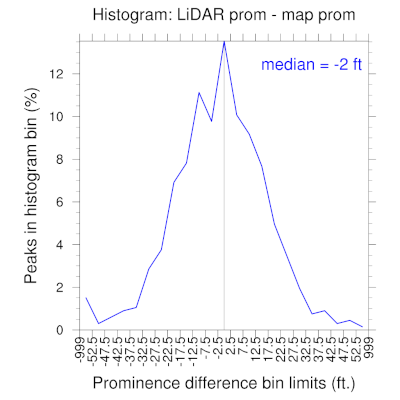
As you can see the mode of the distribution is centered on zero (map prominence = LiDAR prominence), although the distribution is skewed toward the left, so that there are a few more LiDAR prominences less than map prominences than vice versa (i.e., LiDAR prominence is typically slightly less than map prominence.) Also, the distributions sharply tail to near zero by +/-50 ft difference (while many of the extreme tails of the distribution are peaks that replace nearby ranked peaks, rather than brand new ranked peaks. This confirms my perception that peaks with map prominences < 250 ft have a very low probability of being ranked (<1% chance) unless they are a possible candidate to replace an existing nearby ranked peak. I should note, though, that I found one peak Hayden Spire whose map prominence was 87 ft off, so there do exist extreme anomalies, especially in very rugged terrain.

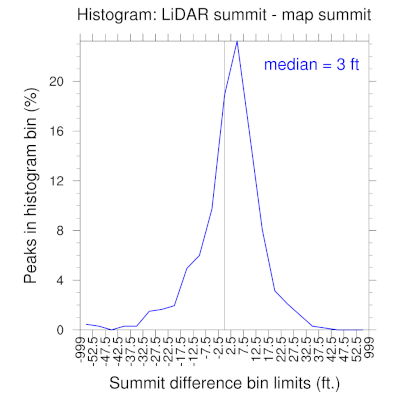
In case it's of interest, here are the histograms for summit elevation difference,
Image

and saddle elevation difference
Image
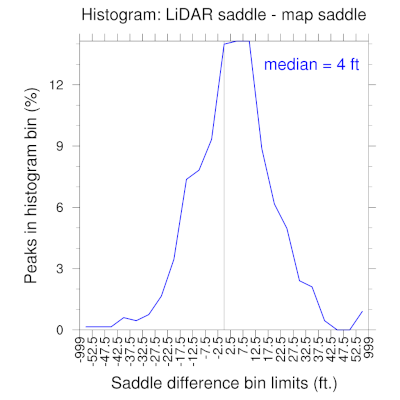
both of which show that LiDAR data is on average slightly higher than map data for summits and saddles.

Please let me know if you would like to see any other analyses.
User avatar
bdloftin77
Posts: 1090
Joined: 9/23/2013
14ers: 58  1 
13ers: 58
Trip Reports (2)
 

Re: LiDAR Peak Analysis: What It Takes

Post by bdloftin77 »

Thanks, Joe! This confirms my thoughts as well. Good thing there are only ~50 more available map P250s vs the few hundred more map P240s.
User avatar
JoeGrim
Posts: 25
Joined: 5/2/2017
14ers: 3 
13ers: 8
Trip Reports (0)
 
Contact:

Re: LiDAR Peak Analysis: What It Takes

Post by JoeGrim »

You're welcome, Ben. I like doing analyses like these for work, so I can determine how much my effort is worth for considering the extreme scenarios; it seemed applicable here for our LiDAR data.

By the way, of the 305 peaks we have analyzed so far with map prominence of exactly 240, and no spot elevations at either saddle or summit, all 305 of them haven't ended up being ranked. In fact, of the 665 P240+ peaks we've analyzed, the lowest map prominence that ended up being ranked was two peaks with 261 ft map prominence.
User avatar
Eli Boardman
Posts: 661
Joined: 6/23/2016
14ers: 58  1  15 
13ers: 18 1
Trip Reports (16)
 
Contact:

Re: LiDAR Peak Analysis: What It Takes

Post by Eli Boardman »

JoeGrim wrote: Sun Apr 24, 2022 3:21 pm..cool stuff edited for brevity...
Nice analysis, I kept wanting to do something like this but never got around to it. I've thought about trying to develop some horrendous algorithm to calculate "credible prominence" in a Bayesian framework based on the minimum LiDAR-derived prominence and factors like terrain roughness, point cloud density, etc., but then I realized...that might be one step too far down the rabbit hole. Regardless, it's interesting to note that the idea of "soft-ranked" could be quantified as a probability distribution that varies for each peak, and "ranked" is the threshold where P(ranked) > some threshold (50%? 95%?).

Anyway, it's also worth noting that all distributions aside, some "expert analysis" will always be required in special cases, e.g. Sharks Nose went from 129 ft. to >304 ft.: https://listsofjohn.com/peak/7036
User avatar
ChrisinAZ
Posts: 437
Joined: 8/11/2010
14ers: 58  14 
13ers: 36
Trip Reports (12)
 

Re: LiDAR Peak Analysis: What It Takes

Post by ChrisinAZ »

Apologies for the thread necromancy...and a million thanks to Eli for getting me started on analyzing LiDAR data properly! (and added thanks to John Kirk for a way to make distinguishing ground points possible).

I've been sticking mostly to fact-checking western US county highpoints, a process I've now nearly completed for those counties with data available (roughly half of the western US, and about 85% of Colorado). Of note to all you Colorado county highpointers, I've found a candidate for Sedgwick County that's about a mile north of the traditional spot, and looks to potentially be slightly higher (within the closed contour at approximately N 40.80496 W 102.64844). As I'll need to come back for this one, anyone who's able to give information on potential landowners here would be greatly appreciated; when I visited the traditional spot years ago, I was the first to actually reach out to the new landowner and found him very friendly, but I suspect the folks who live a mile north of that homestead own the new candidate. For you western CONUS highpoint chasers, Lea and McKinley NM, Wasatch UT, Nez Perce ID, and Adams WA all also have new highpoints or strong contenders for one, as do (thus far) Black Mesa OK and Mt. Davis PA. If anyone wants any further information, feel free to PM me; I'm also posting detailed information here

A question for Eli and any other technological wizards in here: does anyone have the slightest idea how to interpret or work with Alaska data? It looks like (due to snow, cloud cover, etc.) a different method called IfSAR is used there. This is all fine and dandy, except for the part where the downloadable information appears to be completely different; instead of a handy .laz file I can play around with in QGIS, I get a .zip file that seems to have endless nested .tiff files that don't seem to show anything useful on my computer. I've posted a link to an example download, one that apparently includes Denali, for the IfSAR digital surface model (which seems more likely to be what I'm looking for than the orthorectified radar image; LiDAR point cloud info is not available).

https://prd-tnm.s3.amazonaws.com/Staged ... F_2015.zip
Last edited by ChrisinAZ on Tue Jul 12, 2022 4:55 pm, edited 1 time in total.
"If trees could scream, would we be so cavalier about cutting them down? We might, if they screamed all the time, for no good reason."
— Jack Handy


Mah peaks
User avatar
Eli Boardman
Posts: 661
Joined: 6/23/2016
14ers: 58  1  15 
13ers: 18 1
Trip Reports (16)
 
Contact:

Re: LiDAR Peak Analysis: What It Takes

Post by Eli Boardman »

ChrisinAZ wrote: Tue Jul 12, 2022 2:24 pmA question for Eli and any other technological wizards in here: does anyone have the slightest idea how to interpret or work with Alaska data? It looks like (due to snow, cloud cover, etc.) a different method called IfSAR is used there. This is all fine and dandy, except for the part where the downloadable information appears to be completely different; instead of a handy .laz file I can play around with in QGIS, I get a .zip file that seems to have endless nested .tiff files that don't seem to show anything useful on my computer. I've posted a link to an example download, one that apparently includes Denali, for the IfSAR digital surface model (which seems more likely to be what I'm looking for than the orthorectified radar image; LiDAR point cloud info is not available).
I tried it and the DSMs look like normal geotiffs to me--do you have experience working with raster data? It should make a grayscale image like this when you drag-and-drop the tiles into QGIS. Then you can use the pointer ("value tool") the same way you would for the pointcloud data to click on different locations. You would need to adjust the grayscale ramp in the usual symbology menu to narrow in on peaks/saddles. The problem with raster data, of course, is that it's not nearly as precise as pointcloud data, so I'm not sure if there's a ton to be gained by doing this analysis in Alaska.
Capture.JPG
Capture.JPG (90.32 KiB) Viewed 1448 times
User avatar
bdloftin77
Posts: 1090
Joined: 9/23/2013
14ers: 58  1 
13ers: 58
Trip Reports (2)
 

Re: LiDAR Peak Analysis: What It Takes

Post by bdloftin77 »

ChrisinAZ wrote: Tue Jul 12, 2022 2:24 pm Apologies for the thread necromancy...and a million thanks to Eli for getting me started on analyzing LiDAR data properly! (and added thanks to John Kirk for a way to make distinguishing ground points possible).

I've been sticking mostly to fact-checking western US county highpoints, a process I've now nearly completed for those counties with data available (roughly half of the western US, and about 85% of Colorado). Of note to all you Colorado county highpointers, I've found a candidate for Sedgwick County that's about a mile north of the traditional spot, and looks to potentially be slightly higher (within the closed contour at approximately N 40.80496 W 102.64844). As I'll need to come back for this one, anyone who's able to give information on potential landowners here would be greatly appreciated; when I visited the traditional spot years ago, I was the first to actually reach out to the new landowner and found him very friendly, but I suspect the folks who live a mile north of that homestead own the new candidate. For you western CONUS highpoint chasers, Lea and McKinley NM, Wasatch UT, and Lewis ID all also have new highpoints or strong contenders for one, as do (thus far) Black Mesa OK and Mt. Davis PA. If anyone wants any further information, feel free to PM me; I'm also posting detailed information here

https://prd-tnm.s3.amazonaws.com/Staged ... F_2015.zip
Hi Chris! OIT now has a new download process which is much more streamlined than downloading entire counties. You can now download specific, individual tiles with LPC data for many areas not yet available via TNM. I'd recommend keeping the total download size below half a GB though, as anything bigger than that has tended to lag and never complete for me.

https://coloradohazardmapping.com/LidarDownload

Let us know if you find anything else interesting, especially in Colorado. I'll have to take a look at that Sedgwick area - sounds interesting.

A note - Crestone Peak is pretty tricky to analyze. I think lidar caught a false high bump on the summit (possibly a person?) using class 1 returns. I've looked at quite a few pictures of the summit area with people for scale, and I think the true summit is 1-2 feet above the highest logical return, shown on the LoJ peak page (obscured by the unknown object). There are also a few spots right on the summit with multiple returns, not expected on that terrain and above trees (again, likely a person?) So I am not 100 percent positive, though fairly sure that Crestone Peak is higher than East Crestone. Still might be good to visit both though for Saguache county, and E Crestone anyways for Custer.
https://listsofjohn.com/peak/9
https://listsofjohn.com/lidarnotes?id=9
User avatar
ChrisinAZ
Posts: 437
Joined: 8/11/2010
14ers: 58  14 
13ers: 36
Trip Reports (12)
 

Re: LiDAR Peak Analysis: What It Takes

Post by ChrisinAZ »

Some updates!

Eli--thanks for looking into Alaska! Finally figured it out once I unzipped the downloads (actually very similar, slightly tedious process as the one for the CO hazard mapping site). It does indeed look like far less accurate data, but for now and the foreseeable future it's the best we have for Alaska peaks. Will look at borough/census area HPs and find out if there are any surprises. Any idea on a ballpark error range or general accuracy of IfSAR data as compared to LiDAR data?

Ben--many thanks for pointing me toward that site! I was able to review a half dozen CO counties I otherwise couldn't have right now. I agree, Crestone Peak has that one or two areas that look to be artefact of some kind; based on the remaining points, I'm going to call Crestone and E Crestone "too close to call" in terms of relative elevation.

John Kirk (and others)--I have used your method for determining LiDAR points that are ground cover, but have devised another way. Basically, duplicate the layers of interest, then set the duplicated layers as your elevation gradient, set the original layers as by classification, uncheck only ground layer, change the color scheme for every other type to black. Presto--you've got tiles that will only show ground points, and black everywhere else! However, note you may need to zoom in a good bit to see this properly--the black points kind of drown out everything else when zoomed out.
"If trees could scream, would we be so cavalier about cutting them down? We might, if they screamed all the time, for no good reason."
— Jack Handy


Mah peaks
Teresa Gergen
Posts: 247
Joined: 8/12/2012
Trip Reports (0)
 

Re: LiDAR Peak Analysis: What It Takes

Post by Teresa Gergen »

ChrisinAZ wrote: Thu Jul 14, 2022 12:58 am John Kirk (and others)--I have used your method for determining LiDAR points that are ground cover, but have devised another way. Basically, duplicate the layers of interest, then set the duplicated layers as your elevation gradient, set the original layers as by classification, uncheck only ground layer, change the color scheme for every other type to black. Presto--you've got tiles that will only show ground points, and black everywhere else! However, note you may need to zoom in a good bit to see this properly--the black points kind of drown out everything else when zoomed out.
Chris, I tried this too, except using white instead of black to block all else out. Similar zooming issues. However, using ground-only points can be a real problem when there is any rock around that could be natural. With John's method of distinguishing ground from class 1 points, you can still see if there are higher non-ground points in the vicinity, compared to the highest ground point you find, and then do your best with satellite imagery to try to guess if they correspond to natural as opposed to manmade rock features, and thus need to be selected as the high point.
User avatar
ChrisinAZ
Posts: 437
Joined: 8/11/2010
14ers: 58  14 
13ers: 36
Trip Reports (12)
 

Re: LiDAR Peak Analysis: What It Takes

Post by ChrisinAZ »

Teresa Gergen wrote: Thu Jul 14, 2022 7:13 am Chris, I tried this too, except using white instead of black to block all else out. Similar zooming issues. However, using ground-only points can be a real problem when there is any rock around that could be natural. With John's method of distinguishing ground from class 1 points, you can still see if there are higher non-ground points in the vicinity, compared to the highest ground point you find, and then do your best with satellite imagery to try to guess if they correspond to natural as opposed to manmade rock features, and thus need to be selected as the high point.
Teresa--certainly a fair point! Rock outcroppings are certainly more common, and more likely to come into play out west, and are less likely to be missed in the more sparsely-vegetated summits of the high desert. This method may well be more useful in my neck of the woods, in the deep South.

Eli--thanks again for the help with IfSAR! Was able to look at borough highpoint information and even find a new candidate in one case! Just curious if you have any rough estimate the general accuracy of IfSAR when compared to LiDAR...I suspect the boroughs/CAs with a 70' difference in candidates are probably safe to call, but 5' differences seem a lot more squirrelly here...
"If trees could scream, would we be so cavalier about cutting them down? We might, if they screamed all the time, for no good reason."
— Jack Handy


Mah peaks
User avatar
ChrisinAZ
Posts: 437
Joined: 8/11/2010
14ers: 58  14 
13ers: 36
Trip Reports (12)
 

Re: LiDAR Peak Analysis: What It Takes

Post by ChrisinAZ »

Hey all, sorry for the thread necromancy, but I got somewhat of an answer to my previous question! You have AZScott to thank for this--he's a good friend and actually an expert on the software! This doesn't eliminate the issue that some peaks especially in rockier areas may have class 1 returns that represent summit boulders (and in one case in Maine, a slabby summit showed up as road bed!) but it may be invaluable for those midwestern or coastal counties that don't have major natural features. Here's how to display only class 2 (ground) points:

Download your .laz file into qgis, let it compile there like normal. You can "attribute by ramp>z" it like normal as well. Hit ok/apply.

Then, find that tile in the list of files displayed in qgis and RIGHT click it, select "Filter".

Double click "Classification" in the left menu of options. It should appear in the box below.

Then single click "=" in the supplied buttons.

Then double click "2: Ground" in the right menu of options.

Hit "OK".

Bam!! You have a dataset displaying only class 2 returns! Again, use with caution, but I can tell you this will make my life a heck of a lot easier for some data sets!
Last edited by ChrisinAZ on Fri Jan 13, 2023 7:35 am, edited 1 time in total.
"If trees could scream, would we be so cavalier about cutting them down? We might, if they screamed all the time, for no good reason."
— Jack Handy


Mah peaks
User avatar
KentonB
Posts: 713
Joined: 5/13/2007
14ers: 58 
13ers: 56
Trip Reports (3)
 

Re: LiDAR Peak Analysis: What It Takes

Post by KentonB »

ChrisinAZ wrote: Thu Jan 12, 2023 5:54 pm Then, find that tile and RIGHT click it, select "Filter".
ChrisinAZ, as a QGIS newbie, what exactly are you right-clicking on? I'm not sure where "that tile" is. Are you clicking somewhere in the main window where the point cloud is? Or the "Layers" Panel? Or maybe you have a panel up that I don't? Sorry, I've been right-clicking all over my screen and am not getting a Filter option. :-k

I've been using LAStools to pre-filter .las files before I bring them into QGIS, and that's a pain. I'd love to do all my work in QGIS as much as possible.

EDIT: Nevermind. Apparently, this feature isn't in Ver 3.22 (Long Term Release)... or at least it isn't somewhere easy to find. I just downloaded Ver 3.28 and was able to find the Filter option quickly. Thanks!
Post Reply